5 closest test match encounters: A detailed analysis

The charm of the close finish in Tests is unique. Unlike the limited-overs games, Tests provide a longer window for the classic ebbs and flows that are the cornerstone of a thrilling encounter. Teams may start on top and stay on top for nearly two days but can let the advantage slip away with just an hour of poor batting. On the other hand, teams may be evenly balanced nearly till the end of the game but the tide may turn with just one good partnership or a couple of breakthroughs.
Most of us have been lucky enough to watch (at least on television) 2-3 close Test finishes. The closest of them all – the two ties – have perhaps been watched by very few. The margin of victory (or defeat) has often been the only factor used in trying to understand how close a contest has been. However, it does not do complete justice to the sense of theatre that such contests produce.
In this article, I plan to dig deeper into these contests and analyze the pattern and flow of the match across the four innings. The relative position of strength of a team, the ground that the team trailing has to make up, the record and history a team has before the game, and the ultimate pressure of a final-innings chase are all revealed in this detailed analysis. Let me outline a few important factors considered in this article –
1st innings – The first innings analysis considers the runs per wicket (RPW) and the average runs per wicket RPW-R (includes not outs) record for the last ten years leading up to the game for the team batting in the first innings, Diff – the difference between RPW and RPW-R.
2nd innings – RPW – runs per wicket and the runs per wicket required – the average runs per wicket the team needs to get to match the 1st innings score of the opposition, Diff – the difference between RPW and the runs per wicket required.
3rd innings – RPW (effective) – the runs per wicket factoring in the lead or deficit at the end of the match 2nd innings, RPW–R is the average runs per wicket (includes not outs) record for the last ten years leading up to the game for the team batting in the third innings, Diff – the difference between RPW and RPW-R.
4th innings – RPW – runs per wicket, the runs per wicket required – the average runs per wicket the team needs to get to win the match, RPW–R is the average runs per wicket (includes not outs) record for the last ten years leading up to the game for the team batting in the fourth innings, D1 (the difference between the RPW and the required runs per wicket), D2 (the difference between the RPW and the RPW–R).
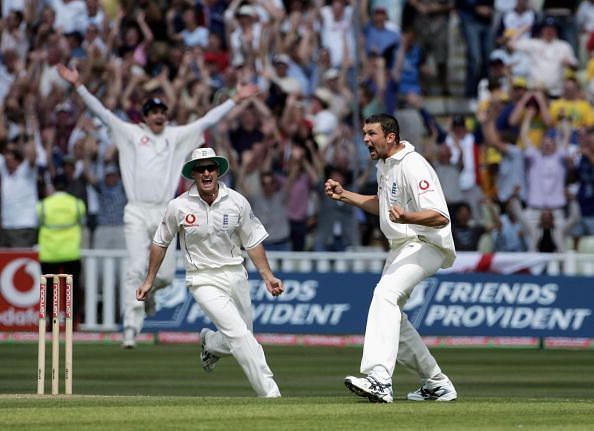
I have picked five matches for this analysis – the two Tied Tests, West Indies’ 1-run win in Adelaide in 1993, England’s amazing victory at Edgbaston in the 2005 Ashes, and the extraordinary chase by Brian Lara’s West Indies in Barbados in 1999. The presence of Australia in every match is not surprising – they have featured not just in these games but also in a one-wicket loss against Pakistan in 1994, a 3-run loss against England in Melbourne in 1982 and the 5-run defeat against South Africa in Sydney in 1994.