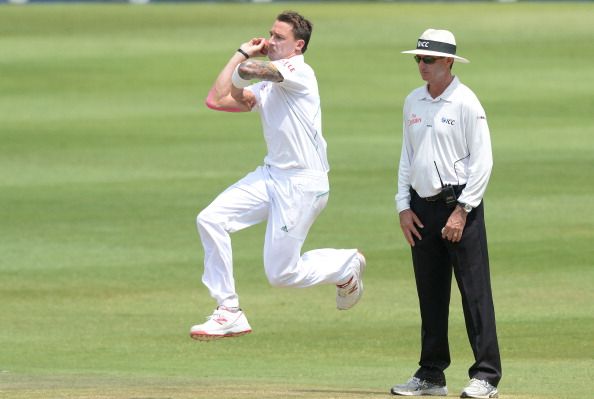
Stats: Comparing Dale Steyn with the great West Indies quicks of the past

Dale Steyn recently celebrated his 10 years in Test cricket with a six-wicket haul in the first Test against West Indies in Centurion. Conceding just 34 runs for the 6 wickets, Steyn has taken his tally of Test wickets to 389, just one short of equalling countryman Makhaya Ntini’s record for the highest number of wickets for South Africa.
Steyn is also on top of the ICC Test Bowling rankings, with Rangana Herath a distant second, 58 rating points behind. The question seems imminent and inevitable.
Is Steyn better than the likes of Andy Roberts & Co.? Let’s try and find out.
Long before there was a fire in Babylon, the West Indian brand of calypso cricket was associated more with flamboyance than with toughness. Something one of its greatest captains, Clive Llyod didn’t take too kindly of. The watershed moment came when after a humiliating 5-1 loss to the Australians,
Llyod, in only his second year of captaincy, decided that enough is enough. Knowing fully well that the West Indies batting could by itself pack a punch, the focus shifted on building a bowling war-machine, comprising of fast bowlers who would hunt like wolves, in packs. Andy Roberts was already around, spearheading an attack consisting of Vanburn Holder, Keith Boyce, and Bernard Julien.
But the story didn’t end there. In came Michael Holding, soon known to be as ‘Whispering Death’, followed by Joel Garner, Colin Croft and Malcolm Marshall. Out of these five, the four fielded in a Test XI could evoke serious fear in the minds of batsmen. Sometimes even before the first ball was bowled. They came to be known as the ‘quartet’.
A good dozen broken jaws, and hundreds of shattered stumps later, in 1984, debuted Courtney Walsh, who would eventually take West Indies fast bowling to never seen before heights.
It’s only apt that Steyn be pitted against these names, for a true measure of his greatness. But the most difficult bit in doing so, was in comparing players from two completely different time periods. Cricket, like every other sport, has evolved. When the West Indies pace battery prowled, there used to be uncovered wickets, lesser protection on batsmen, no curb on the number of bouncers in an over, so isn’t the potency almost expected?
Conversely, batsmen are more attacking these days, providing more opportunities to a bowler to get him out, there’s an entire army of support staff that helps professional cricketers to remain fit and in shape, leading to lesser injuries and more games, don’t forget the technology that’s there to assist in demystifying a batsman and what not. So factoring in all these variables almost became necessary, and an absolute comparison of the respective records of these bowlers had to be rejected.
I decided to handpick a few West Indies pacers to compare Steyn with, and the names that came to my mind included those who formed the quartet: Roberts, Holding, Garner, Croft and Marshall. They all played in era starting in 1974 with Roberts’ debut and ending in 1991 with Marshall’s retirement. For reference sake, I will call these 17 years as the Quartet Era.
In between 1984 and 1991, two very successful West Indian fast bowlers debuted, in the form of Walsh and Curtly Ambrose, in 1984 and 1988 respectively. While, the early bit of Walsh’s career coincides with the Quartet Era, I would like to place him in a separate time frame (along with Ambrose), starting with his debut in 1984 and his retirement in 2001.
This phase especially saw the fast-bowling boom of the 90s with McGrath, Lee and Donald all making an entry into international cricket. Herein, I will refer to these 17 years between 1984 and 2001, as the Walsh Era. Post 2004 and the coming of Dale Steyn, world cricket has just seen one era, the Steyn Era, going strong even after 10 long years.
My methodology revolves around comparing the relative performances (using metrics such as wickets, average and strike-rate) of each bowler in his respective era, and thereby measuring how good he was in his time. This allows one to factor in the then prevailing variables, and gives a clearer comparison albeit not fully perfect.
(Note: The ‘Overs’ in the tables have been expressed mathematically. So, if it is 3.2 overs, it implies 3 overs and 2 out of 6 balls, shown here as 3.33 overs. This has been done to assist in calculation)
Fast bowling performances over the years
During the Quartet Era, as many as 9043 wickets were claimed by fast bowlers alone, all over the world. As on expected lines, the most lethal of the lot were the West Indies, snapping 22.5% of those wickets at nearly 4.5 runs lesser per wicket than the second best Australia. The balls per wicket were also significantly lower for the West Indies than what was the average then. West Indies dismissed one batsman in every 54 deliveries, while the prevailing average was of 63 deliveries.
| PACE BOWLER PERFORMANCE DURING QUARTET ERA | |||||
|---|---|---|---|---|---|
| Team | Balls | Runs | Wickets | Average | SR |
| England | 119068 | 57350 | 1834 | 31.27 | 64.92 |
| Australia | 120390 | 56311 | 1929 | 29.19 | 62.41 |
| West Indies | 110746 | 50523 | 2038 | 24.79 | 54.34 |
| India | 54355 | 27787 | 789 | 35.22 | 68.89 |
| Pakistan | 72560 | 32251 | 1093 | 29.51 | 66.39 |
| New Zealand | 72238 | 31761 | 1050 | 30.25 | 68.80 |
| Sri Lanka | 20517 | 10921 | 310 | 35.23 | 66.18 |
| 569874 | 266904 | 9043 | 29.51 | 63.02 | |
Things remained pretty much the same for the next 17 years, when Walsh wreaked havoc all over. While the wicket count of pace bowlers increased due to the entry of new teams like South Africa and Zimbabwe, the combined bowling average of all fast bowlers remained somewhat around what it was during the Quartet Era. The strike-rate in the Walsh Era, too, was similar to that during the Quartet Era. Apart from the 7 years that overlap, this consistency in numbers can be attributed to the fact that cricket was still in a transitional phase, the cricketing revolution of the 2000s was yet to arrive, and status quo was being maintained.
| PACE BOWLERS’ PERFORMANCE DURING WALSH ERA | |||||
|---|---|---|---|---|---|
| Team | Overs | Runs | Wickets | Average | SR |
| West Indies | 18262.83 | 49964 | 1984 | 25.18 | 55.23 |
| Australia | 17923.33 | 50729 | 1786 | 28.40 | 60.21 |
| England | 19637.33 | 58795 | 1779 | 33.05 | 66.23 |
| New Zealand | 15066.33 | 42463 | 1287 | 32.99 | 70.24 |
| Pakistan | 12142 | 34794 | 1278 | 27.23 | 57.00 |
| South Africa | 11354.16 | 28689 | 1147 | 25.01 | 59.39 |
| India | 9100 | 26357 | 772 | 34.14 | 70.73 |
| Sri Lanka | 8364.5 | 24911 | 667 | 37.35 | 75.24 |
| Zimbabwe | 5605.33 | 15152 | 451 | 33.60 | 74.57 |
| Bangladesh | 161 | 534 | 11 | 48.55 | 87.82 |
| 117616.8 | 332388 | 11162 | 29.78 | 63.22 | |
However, the first significant change in these statistics came in the period succeeding Steyn’s debut. The impact of the popular limited overs cricket, aided with the new found aggressive mindset of posting totals at a faster rate and attempting to chase down targets, pioneered by the Australian team of the Waugh-Ponting regime, saw the runs per wicket average for fast bowlers increase. However, an attempt to score quicker and score more, resulted in the fall in the average strike-rate of the world’s fast bowlers.
| PACE BOWLERS’ PERFORMANCE IN DALE STEYN ERA | |||||
|---|---|---|---|---|---|
| Team | Overs | Runs | Wickets | Average | SR |
| England | 14834.16 | 46951 | 1497 | 31.36 | 59.46 |
| Australia | 13032 | 39421 | 1365 | 28.88 | 57.28 |
| South Africa | 11726.16 | 36752 | 1328 | 27.67 | 52.98 |
| New Zealand | 8668.67 | 27471 | 842 | 32.63 | 61.77 |
| India | 8559.67 | 29625 | 813 | 36.44 | 63.17 |
| West Indies | 9041.33 | 29993 | 803 | 37.35 | 67.56 |
| Pakistan | 7015 | 23860 | 678 | 35.19 | 62.08 |
| Sri Lanka | 6656.67 | 22674 | 557 | 40.71 | 71.71 |
| Bangladesh | 3548.16 | 13153 | 239 | 55.03 | 89.08 |
| Zimbabwe | 2286.83 | 7029 | 203 | 34.63 | 67.59 |
| World XI | 74.5 | 246 | 12 | 20.50 | 37.25 |
| 85443.15 | 277175 | 8337 | 33.25 | 61.49 | |