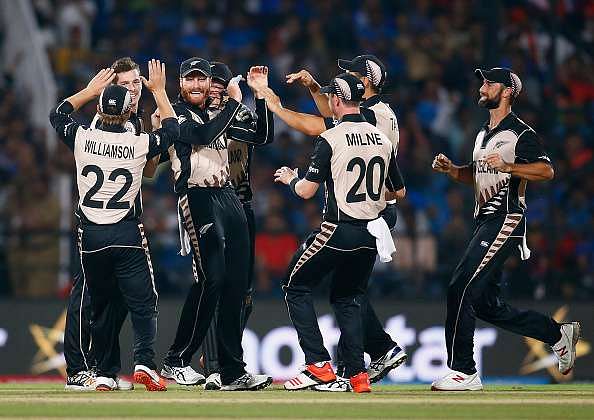
Australia vs New Zealand,ICC World T20 2016: Player vs Player stats
After extending their winning run over India in T20Is in the opening game of the ICC World T20 in Nagpur, New Zealand take on Australia on Friday, hoping to exact some revenge for their loss in the ICC World Cup final last year. While the Kiwis are already off to a winning start, Australia will be looking to continue their winning run from the recently concluded three-match T20I series against South Africa.
Also read: Australia vs New Zealand, WT20 2016- LIVE streaming, LIVE score updates, Ball by Ball Commentary, Team news and more
Although Australia hold the upper hand in terms of history, the Black Caps will be on cloud nine after winning their opening encounter against the pre-tournament favourites, India, so convincingly.
Although the pair have faced each other across multiple formats, this will be the first clash between the two in a World T20. Overall, in T20Is, Australia have won four and there has been a tie.
With one side considerably holding the upper hand in terms of history and the other in terms of recent form, it should certainly be interesting to see how the encounter on Friday turns out.
In this article, we statistically compare the expected playing XIs of both sides and attempt to judge which team will start the contest as favourites. The winner between each duo has been judged only by T20 career stats and not talent, form or anything else.
| Australia | New Zealand | Who’s better? |
|---|---|---|
Aaron Finch Runs –916, Avg – 39.82, SR – 152.92 | Kane Williamson Runs – 852, Avg – 35.50, SR – 125.84 | Australia |
Shane Watson Runs – 1366, Avg – 28.45, SR – 145.01 | Martin Guptill Runs – 1672, Avg – 34.12, SR – 129.91 | TIE |
Steve Smith Runs – 348, Avg – 20.47, SR – 122.96 | Colin Munro Runs – 389, Avg – 24.31, SR – 158.13 | New Zealand |
David Warner Runs – 1595, Avg – 29.53, SR – 140.77 | Ross Taylor Runs – 1175, Avg – 23.97, SR – 119.89 | Australia |
Glenn Maxwell Runs – 502, Avg – 21.82, SR – 160.38 | Grant Elliott Runs – 116, Avg – 14.50, SR – 100.86 | Sample too small to judge |
Peter Nevill Runs – 4, Avg – 4, SR – 80 | Luke Ronchi Runs – 309, Avg – 22.07, SR – 141.09 | Sample too small to judge |
James Faulkner Runs – 124, Avg – 20.66, SR – 114.81 Wickets – 19, Avg – 23.26, RPO – 8.23 | Corey Anderson Runs – 263, Avg – 21.91, SR – 131.50 Wickets - 12, Avg – 35.75, RPO – 8.41 | TIE |
Mitchell Marsh Runs – 103, Avg – 25.75, SR – 137.33 Wickets – 3, Avg – 35.66, RPO – 8.91 | Mitchell Santner Runs – 29, Avg – 9.66, SR – 78.37 Wickets – 11, Avg – 10.27, RPO – 5.65 | Sample too small to judge |
Adam Zampa Wickets – 0, Avg – , RPO – 6.12 | Nathan McCullum Wickets – 57, Avg – 22.31, RPO – 6.86 | Sample too small to judge |
Nathan Coulter-Nile Wickets – 20, Avg – 20, RPO – 8.16 | Trent Boult Wickets – 15, Avg – 21.73, RPO – 7.95 | Sample too small to judge |
Josh Hazlewood Wickets – 7, Avg – 29.28, RPO – 10.25 | Tim Southee Wickets – 46, Avg – 25.69, RPO – 8.62 | Sample too small to judge |
Australia 2 – 1 New Zealand | ||
NOTE: The lineups mentioned above are predicted teams and might not actually be the XIs that take to the field on Friday.
Summary
While both teams have a settled top order, the middle-order is filled with some big-hitters on both sides while the Australian bowling attack is significantly short on experience when compared to their rivals.
Unsurprisingly, given the wealth of IPL experience the Australians possess, they have the more explosive batting line-up, even if the two sides are evenly matched when it comes to experience in the batting order.
As far as the bowlers are concerned, the Kiwis holds the advantage as they have the more experienced bowling attack, whether it is in the pace department or spinners.
On paper, Australia have the more explosive batting line-up while the Black Caps hold the upper hand when it comes to the bowling as they have more experience and wicket-takers. But given the confidence boosting win that the Kiwis enjoyed only a few days ago, they wil go in as favourites into this Trans-Tasman clash.
