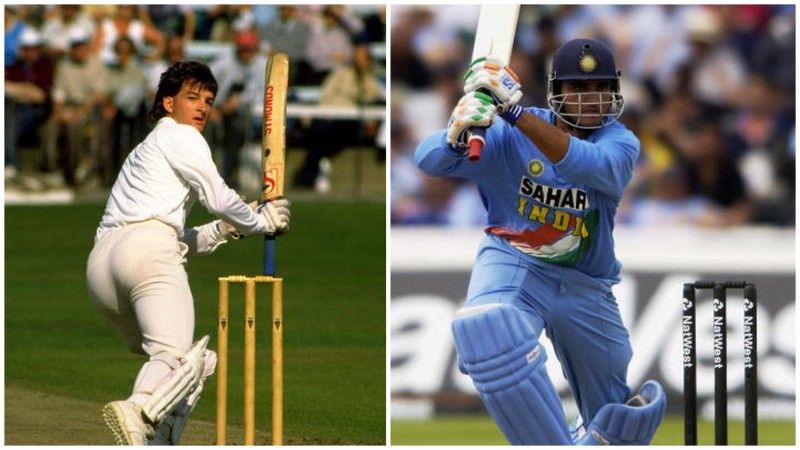
Mark Waugh vs Sourav Ganguly - A statistical comparison of two elegant batsmen

Sportsmen are loved for various reasons; some for guts, some for style, some for heart, some for numbers. Some are loved for overachieving and some are loved in spite of underachieving.
Where do Mark Waugh and Sourav Ganguly fall in that spectrum? Elegant? Definitely. Like velvet. Like they held bats that could make balls fly with a mere smooth touch, a gentle whisper, a kiss.
Gifted? Oh yes. Both were showered with the gift of timing. Waugh could play the silky smooth on-drive off the pads, while Ganguly could send balls screaming through the covers with just a nudge or a push.
One was a great slip catcher, one was a great leader. One was calm almost to the point of looking lazy, the other was ferocious. Both were legends of the game, both given polite nudges into retirement. In Ganguly’s favour, he did put in the hard fight to leave on his own terms – with the proverbial fanfare.
Interestingly, the two men have had remarkably similar careers, both in Tests and ODIs. But their numbers suggest one thing – they could have gotten more. Waugh was blamed for being lazily casual, like David Gower or lately, Rohit Sharma.
Ganguly, on the other hand, had issues with the short ball and was initially limited on the onside, even though he was certified ‘God of offside’ by none other than Rahul Dravid. But given his start, he could have done a lot more, especially if the late-career tussle with Greg Chappell hadn’t happened.
Here, we dissect the numbers of the two great batsmen and see if we can find who was better, if that is even possible.
In Tests
Ganguly didn’t play as many Tests as Waugh did. While the small difference between innings and hence runs can be explained, Waugh edges Ganguly out on the number of centuries and half-centuries.
Waugh has four centuries more and 67 fifty-plus scores, which is nearly 1/3rd of his appearances. For Ganguly, it is 51, a lot fewer than Waugh. While that reflects batting quality, it could be argued that Waugh had played in better Test teams with better bowling attacks – ergo, less pressure on the batsmen.
|
Overall in Tests |
Innings |
Runs |
Average |
Strike-rate |
100s/50s |
|---|---|---|---|---|---|
|
Sourav Ganguly |
188 |
7212 |
42.17 |
51.25 |
16/35 |
|
Mark Waugh |
209 |
8029 |
41.81 |
52.27 |
20/47 |
Numbers at home
At home, both batsmen average more or less the same. Also interestingly, both averaged much lower in the other’s country. Ganguly averaged a pedestrian 35 in Australia compared to his career average of 42 while Waugh averaged a measly 33 in India compared to a career average of close to 42. Waugh has more runs at home than Ganguly has, owing to 15 more innings.
|
At home |
Innings |
Runs |
Average |
Strike-rate |
100s/50s |
|---|---|---|---|---|---|
|
Sourav Ganguly |
84 |
3180 |
42.97 |
50.60 |
8/13 |
|
Mark Waugh |
99 |
4019 |
43.21 |
51.93 |
11/23 |
Numbers away from home
Both batsmen have similar averages away from home as well, although at a minute level, Ganguly edges ahead with more runs in fewer innings. There is not much to separate both batsmen, home or away, showing how similar their career graphs have been. One was right-handed and the other a southpaw, but both had the propensity for elegant run-scoring.
|
Away |
Innings |
Runs |
Average |
Strike-rate |
100s/50s |
|---|---|---|---|---|---|
|
Sourav Ganguly |
104 |
4032 |
41.56 |
51.78 |
8/22 |
|
Mark Waugh |
110 |
4010 |
40.50 |
52.61 |
9/24 |
Contribution in matches won
This is one place where the two batsmen have been tremendously different in terms of runs. Waugh nearly played twice the number of Test innings as Ganguly and averages more than two points higher. Waugh has 11 more centuries and twice the number of fifties as Ganguly.
There are two factors that must be noted here. Waugh was part of a winning team which meant he was more often part of wins than Ganguly was. Also, their overall averages don’t show a big jump, which means both were consistent overall without really affecting their team’s numbers hugely.
So while a difference of 2500 runs is accounted for based on the number of innings, winning Waugh a few brownie points, Ganguly batted under greater pressure overall.
|
Wins |
Innings |
Runs |
Average |
Strike-rate |
100s/50s |
|---|---|---|---|---|---|
|
Sourav Ganguly |
58 |
2284 |
46.61 |
50.40 |
4/14 |
|
Mark Waugh |
110 |
4794 |
48.91 |
54.05 |
15/28 |
Scores in different innings
This dissection of runs scored in each innings of a match shows further how close the two batsmen are in terms of numbers. For example, no matter what the pitch condition is, the second innings is generally the easiest to bat on and the fourth the toughest. Yes, there are exceptions, but this is the classic scenario.
Waugh averages higher in the second innings but also higher in the fourth innings. His third innings average is below 35. Ganguly seems like the more consistent batsman here; his lowest is 37.5 in the third innings with the gap between lowest and highest averages being much less than that of Waugh’s.
However, Waugh has four centuries while batting second (third or fourth innings), while Ganguly has only one.
|
First Innings |
Innings |
Runs |
Average |
Strike-rate |
100s/50s |
|---|---|---|---|---|---|
|
Sourav Ganguly |
53 |
2342 |
45.92 |
52.13 |
9/8 |
|
Mark Waugh |
73 |
3080 |
43.48 |
53.94 |
7/22 |
|
Second Innings |
Innings |
Runs |
Average |
Strike-rate |
100s/50s |
|
Sourav Ganguly |
58 |
2427 |
41.84 |
48.46 |
6/12 |
|
Mark Waugh |
55 |
2488 |
46.94 |
54.51 |
9/9 |
|
Third Innings |
Innings |
Runs |
Average |
Strike-rate |
100s/50s |
|
Sourav Ganguly |
45 |
1579 |
40.48 |
52.65 |
0/12 |
|
Mark Waugh |
54 |
1641 |
34.18 |
46.5 |
2/14 |
|
Fourth Innings |
Innings |
Runs |
Average |
Strike-rate |
100s/50s |
|
Sourav Ganguly |
32 |
864 |
37.56 |
54.99 |
1/3 |
|
Mark Waugh |
27 |
820 |
41 |
52.63 |
2/2 |
Performance against different opposition
It is often an indicator of a batsman’s greatness when he scores tough runs against the best contemporary teams. Ganguly averaged high against England especially in England, a place where many Indian batsmen struggled. He also averaged high against the sub-continent rivals, Pakistan and Sri Lanka.
The southpaw was not up to scratch against Australia, West Indies and South Africa, without a single century against WI or SA. However, Ganguly averages over 40 in West Indies.
|
Opposition |
Innings |
Runs |
Average |
Strike-rate |
100s/50s |
|---|---|---|---|---|---|
|
Australia |
44 |
1403 |
35.07 |
52.58 |
2/7 |
|
England |
19 |
983 |
57.82 |
53.04 |
3/5 |
|
New Zealand |
15 |
563 |
46.91 |
59.01 |
3/2 |
|
Pakistan |
20 |
902 |
47.47 |
55.3 |
2/4 |
|
South Africa |
31 |
947 |
33.82 |
55.31 |
0/7 |
|
Sri Lanka |
24 |
1064 |
46.26 |
45.02 |
3/4 |
|
West Indies |
16 |
449 |
32.07 |
41.53 |
0/2 |
Mark Waugh, when compared to Ganguly, didn’t do so well against the sub-continent teams, averaging 33 and 24 against India and Sri Lanka respectively. That said, he did score at 42 against Pakistan.
Unlike Ganguly, Waugh did well against South Africa and West Indies, averaging over 40. West Indies was a highly competitive team in the 90s when Waugh played most of his cricket.
Interestingly, Waugh was considered one of the better Australian players against spin, although his numbers against Sri Lanka prove otherwise, strangely. Moreover, Waugh averages a dismal 12 in Tests played in Sri Lanka even though he has an impressive average of over 40 in India and in Pakistan.
|
Opposition |
Innings |
Runs |
Average |
Strike-rate |
100s/50s |
|---|---|---|---|---|---|
|
England |
51 |
2204 |
50.09 |
55.85 |
6/11 |
|
India |
24 |
698 |
33.23 |
47.77 |
1/4 |
|
New Zealand |
20 |
766 |
42.55 |
57.07 |
1/5 |
|
Pakistan |
22 |
933 |
42.4 |
54.81 |
3/6 |
|
South Africa |
29 |
1135 |
42.03 |
49.34 |
4/4 |
|
Sri Lanka |
14 |
345 |
24.64 |
49.42 |
1/3 |
|
West Indies |
48 |
1858 |
41.28 |
49.45 |
4/13 |
Clearly, comparing the two stalwarts in Tests is tough, with both men pulling punches in different segments.