Stats: Winning the Toss and Batting First Propensities
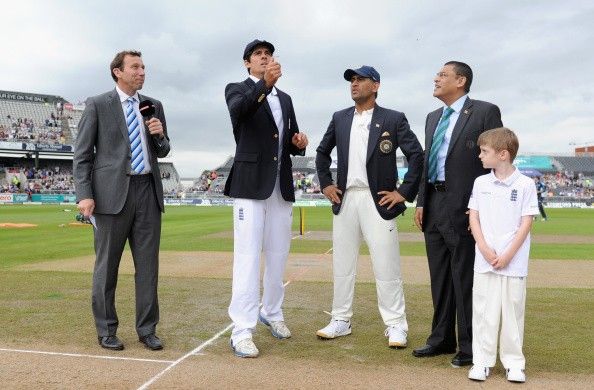
Recently, there has been a debate in the cricketing circles to eliminate the toss from test cricket. Some proponents of the theory suggest that rather than spinning the coin the guest team should be given the choice whether to bat first or bowl. They say in this way the advantage of the home side while preparing the pitch shall lessen.
In the previous Bangalore test between South Africa and India, Virat Kohli after winning the toss opted to field first. It was after 41 years that a captain winning the toss at Bangalore has decided not to bat first.
During the Delhi test, it was found out that no team has ever opted to bat second after winning the toss at the Feroz Shah Kotla stadium Delhi. It is indeed an apparent rarity that despite hosting 33 Test matches Delhi stadium has not seen a team that batted second after winning the toss.
So, we decided to dig some numbers to find out how many teams actually are afraid of batting second and are more keen to put on some runs on the scorecard for the other team to chase them eventually in the fourth innings of a test.
It is no hidden fact that chasing a total in the fourth inning is indeed a very difficult task. But the numbers we came across suggest that the international cricketers are equally, if not more, eager to bat first after winning the toss when compared to the street boys.
We also went some steps further to find out which stadiums and countries have the highest win toss-bat first percentage. The research came up with some interesting points. Let us first see how batting first tendencies are across different formats of international cricket.
Tests have the highest percentage (by a margin of 20 percent) of teams batting first after winning the toss while in limited overs format the decision is almost fifty-fifty with balance slightly tilting in favour of batting first.
W/L Ratio for teams winning the toss and batting first is above 1 for Tests, T20Is and also overall matches, but lower than 1 for ODIs.
|
Format |
Matches Played |
Toss Won- Batted First |
Percentage |
Won |
Lost |
Tie |
Drawn/NR |
W/L Ratio |
|---|---|---|---|---|---|---|---|---|
| All International Matches | 6376 | 3763 | 59.02 | 1584 | 1553 | 26 | 599 | 1.019 |
| Tests | 2191 | 1597 | 72.89 | 555 | 496 | 2 | 543 | 1.118 |
| ODIs | 3712 | 1916 | 51.62 | 901 | 941 | 19 | 55 | 0.957 |
| T20Is | 473 | 250 | 52.85 | 128 | 116 | 5 | 1 | 1.103 |
Now we will focus only on Test Matches.
Win-Toss Bat First Team by Team Comparison (Tests)
When we ran our fingers across the record books, we found out that England is the team most likely to bat first after winning the toss. At an overwhelming 80+ percentage, England has batted first 4 times out 5 when they won the toss, and fielded first only once.
Australia and India have a percentage of 80 and 77 respectively and are on number 2 and 3.
Excluding Zimbabwe and Bangladesh, New Zealand is the least successful team after winning the toss and batting first with a win-loss ratio of just 0.355 in such matches.
Among top 8 Nations, 6 have a win-loss ratio in excess of 1 when playing first after winning the toss – which means they win the test game more often than not when batting first after winning the toss.
Only West Indies and New Zealand (among top 8 nations) have a W/L ratio lower than 1.
The percentage has not dropped below 60 for any team. New Zealand has the lowest percentage at 60.59.
The table is presented below for further analysis.
|
Team |
Matches Played |
Won Toss |
Won Toss- Batted First |
Percentage Batting First |
Won |
Lost |
Tied |
Drawn |
W/L Ratio |
|
|---|---|---|---|---|---|---|---|---|---|---|
| England | 965 | 465 |
|
80.43 | 143 | 90 | 0 | 141 | 1.588 | |
| Australia | 783 | 397 | 317 | 79.85 | 156 | 81 | 1 | 79 | 1.925 | |
| India | 495 | 250 | 193 | 77.20 | 56 | 51 | 0 | 85 | 1.098 | |
| South Africa | 396 | 189 | 144 | 76.19 | 53 | 51 | 0 | 40 | 1.039 | |
| Pakistan | 395 | 188 | 127 | 67.55 | 35 | 32 | 0 | 60 | 1.093 | |
| Zimbabwe | 97 | 56 | 37 | 66.07 | 3 | 25 | 0 | 9 | 0.12 | |
| West Indies | 510 | 262 | 170 | 64.89 | 55 | 61 | 1 | 53 | 0.901 | |
| Bangladesh | 93 | 48 | 30 | 62.50 | 4 | 21 | 0 | 5 | 0.19 | |
| Sri Lanka | 243 | 133 | 82 | 61.65 | 29 | 25 | 0 | 28 | 1.16 | |
| New Zealand | 404 | 203 | 123 | 60.59 | 21 | 59 | 0 | 43 | 0.355 |
