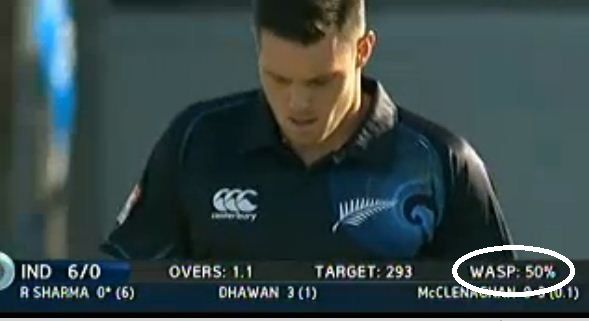
WASP doesn't have much buzz

Over the years, there have been different methods for predicting the runs scored by a team in a cricket match, with projected scores being displayed at various stages of the game. The newest addition to this is the WASP (Winning And Score Prediction), which was developed by two Kiwis Seamus Hogan and Scott Brooker.
The models are based on a database of all non-shortened One-day internationals and 20-20 games played between top-eight countries since late 2006 (slightly further back for 20-20 games). The first-innings model estimates the additional runs likely to be scored as a function of the number of balls and wickets remaining. The second innings model estimates the probability of winning as a function of balls and wickets remaining, runs scored to date, and the target score.
The estimates are said to be obtained using a dynamic programme rather than just curve fitting to the data. To illustrate, to calculate the expected additional runs when a given number of balls and wickets remain in the first innings, we could just average the additional runs scored in all matches when that situation arose. This would work fine for situations that have occurred a lot such as 1 wicket down after 10 overs or 5 wickets down after 40 overs, etc., but for rare situations like 5 wickets down after 10 overs or 1 wicket down after 40, it would be problematic, partly because of a lack of precision when sample sizes are small but more importantly because those rare situations will be overpopulated with games where there was a mismatch in skills between the two teams.
Instead, what we do is estimate the expected runs and the probability of a wicket falling on the next ball only. Let V(b,w) be the expected additional runs for the rest of the innings when b (legitimate) balls have been bowled and w wickets have been lost, and let r(b,w) and p(b,w) be the estimated expected runs and the probability of a wicket on the next ball in that situation respectively. We can then write,
V(b,w) =r(b,w) +p(b,w) V(b+1,w+1) +(1-p(b,w)))V(b+1,w)
Since V(b*,w)=0, where b* equals the maximum number of legitimate deliveries allowed in the innings (300 in a 50 over game), we can solve the model backwards. This means that the estimates for V(b,w) in rare situations depends only slightly on the estimated runs and probability of a wicket on that ball, and mostly on the values of V(b+1,w) and V(b+1,w+1), which will be mostly determined by thick data points. The second innings model is a bit more complicated, but it uses essentially the same logic.
The WASP developers claim that the WASP is different from other forecasts and projections in a way that the predictions are not forecasts that could be used to set TAB betting odds. Rather they are estimates about how well an average batting team would do against an average bowling team in the conditions under which the game is being played. That is, the “predictions” are more a measure of how well the teams have done to that point, rather than forecasts of how well they will do from that point on.