Where to from here, MS?
I’ve chosen the choicest of occasions to ask this question. It seems to be a rhetoric, in the hindsight, for there isn’t much space in all three dimensions that MS Dhoni hasn’t traversed. There’s an opinion that he must stop traversing and there’s another that maybe he should limit his expeditions and keep them confined to a realm or two.
The problem, if at all there is one, isn’t that there are opinions hovering around the man, but that he’s making confused attempts at liberation that have neither convincingly pronounced his new role in the side nor have they stamped his authority over the positions he is still expected to own.
That Dhoni has no longer been the finisher he once was has been a foregone conclusion. That he has, in his own capacity, transitioned from a lower-order maverick with his skills on the decline, to a middle-order veteran – maybe not a maverick here – needs to be established.
Since 2015, out of the 36 innings that he has played, 8 have been at No. 4, 16 have been at No. 5, and 12 have been at No. 6. His average of 43.36 from these innings, scoring 1304 runs at a strike-rate of 85.17, at least statistically, can be deemed as decent.
However, stats aren’t the only parameter to judge the credibility of the player. His longevity and the impact on the game are the other two prominent ones, from a fairly long list of attributes. Longevity, for Dhoni, is synonymous to Niranjan Shah’s tenure at the Vidarbha Cricket Association, which the 73-year-old equates to the tenure of the President of the country.
It is the impact that the now 36-year-old has had on the outcome of the game that’s been put under the scanner and analyzed freckle-by-freckle. It is here that cries and cauldrons have been set ablaze as if it is Dhoni and Dhoni alone who determines the how a pigeon flutters its wings on the field and inside the dressing room.
To begin this analysis, I would first present the numbers across various batting positions that Dhoni has put together since the beginning of 2015. A fairly recent sample space of two years and 36 innings must suffice here.
Dhoni’s numbers since 2015
| Batting position | Innings | Runs | Average | Strike-rate |
| 4 | 8 | 313 | 39.12 | 76.34 |
| 5 | 16 | 642 | 49.38 | 90.04 |
| 6 | 12 | 349 | 38.77 | 85.53 |
| Total | 36 | 1304 | 43.46 | 85.17 |
While these averages aren’t cringeworthy by any stretch of the imagination, whether or not they do justice to these batting positions and the style of cricket that the teams play can be determined by comparing these to the numbers of those who play at these batting positions consistently for their teams.
From teams with a less deviating batting line-up, AB de Villiers, George Bailey, and Ben Stokes’ numbers – all of whom have played more than 30 innings – make for a decent comparative analysis, as they have, since 2015, batted mostly at 4, 5 or 6.
Since 2015 (at numbers 4,5 and 6)
| Player | Innings | Runs | Average | Strike-rate |
| AB de Villiers (SA) | 43 | 1960 | 59.39 | 112.83 |
| MS Dhoni (IND) | 36 | 1304 | 43.46 | 85.17 |
| Ben Stokes (ENG) | 33 | 1272 | 45.42 | 103.75 |
| George Bailey (AUS) | 34 | 1099 | 35.45 | 76.69 |
The table above shows how some of the best batsmen – when it comes to batting in the middle order – have fared in the past two years, and by those standards, Dhoni’s numbers aren’t far off the mark.
Setting de Villiers’ stats as the benchmark, if we are to rate the numbers of the rest three, Dhoni trumps Stokes and Bailey in terms of runs, has a batting average greater than that of Bailey and almost equal to that of Stokes.
However, Stokes strikes the ball better than both Dhoni and Bailey, and that is where he creates more impact on the game, especially in the death overs. This aspect was Dhoni’s forte not until long ago.
Whether that still is the former Indian captain’s forte, and whether amidst the disappointments of his failures to finish off games, his numbers and at the attached merit to them has been lost or not can be determined if we narrow the numbers in the above table down to those in the 2nd innings.
Since 2015 while chasing (at numbers 4, 5, and 6)
| Chases | Successful chases | ||||||||
| Player | Innings | Runs | Average | Strike-rate | Innings | Runs | Average | Strike-rate | Conversion Rate (CR) |
| AB de Villiers | 18 | 743 | 61.91 | 104.64 | 8 | 314 | 157.00 | 105.36 | 44.44% |
| MS Dhoni | 17 | 579 | 38.60 | 76.99 | 6 | 271 | 67.75 | 91.86 | 35.29% |
| Ben Stokes | 15 | 405 | 36.81 | 95.97 | 10 | 353 | 58.83 | 96.18 | 66.67% |
| George Bailey | 18 | 642 | 42.80 | 78.10 | 12 | 544 | 60.44 | 85.26 | 66.67% |
Again, setting de Villiers’ numbers as the benchmark, it can be seen that Dhoni averages better than Stokes in the 2nd innings but doesn’t strike the ball as well. Bailey, on the other hand, averages better than both Stokes and Dhoni but strikes it approximately as well as Dhoni does.
The question to be asked after looking at these two tables is the kind of parameter that deems a player fit to play at a particular position in ODIs. Dhoni's chasing credentials have been on a decline, and yet he averages almost as well as Stokes does in run chases.
This means Dhoni is getting the runs, but he isn’t getting them quickly enough. This is also the reason why he had expressed his desire to bat up the order, which, owing to the failures of the trial-and-error method that India have applied with their middle-order batsmen since 2015, has not been granted.
And yet, at 5, where Dhoni has played most of his 36 innings, he averages close to 50 and strikes at 90. It is when we consider run chases in winning causes that his numbers present themselves in stark contrast to whatever has been written so far.
Before getting into the intricacies of successful chases, the premise of an outcome not being entirely dependent on one player’s performances must be stated. A player could be judged or analyzed based on how well he contributes in run chases, and not whether he manages to finish off games on his own.
Since Dhoni had been doing exactly that for a better part of the last decade and the first half of this decade, this attribute has been mistaken to be the yardstick to measure a player's performances and justify his place in the team.

Keeping the premise in mind, Dhoni’s average and strike-rate in successful chases are good, compared to de Villiers’ numbers, but it must also be noticed that he has been finishing the games less often – 6 out of the 17 chases (35.29% conversion rate (CR)).
Comparatively, Stokes has helped finish 10 out of 15 ( 66.67% CR) chases, while Bailey has done so on 12 out of 18 occasions (66.67% CR). Hence the clarion of ‘the best finisher in the world’ no longer being just that stands justified.
However, does the ‘best finisher’ cease to be a good player after he fails finishing? Even at the death of his finishing abilities, he averages 67 in successful run-chases and strikes at 91.
While these inter-team comparisons were done to elucidate how and where does the cricketer stand amongst his peers who perform the same roles for their respective sides, an intra-team fact-check would put Dhoni’s numbers in perspective.
No middle-order batsman has been as consistent in the Indian line-up as Dhoni, and hence, for a stat-check, his numbers need to be put against the premier three top-order batsmen that India have had since 2015.
Overall stats since 2015
| Player | Innings | Runs | Average | Strike-rate |
| Virat Kohli | 43 | 2049 | 62.09 | 92.79 |
| Rohit Sharma | 32 | 1683 | 58.03 | 93.70 |
| MS Dhoni | 36 | 1304 | 43.46 | 85.17 |
| Shikhar Dhawan | 37 | 1543 | 41.70 | 91.73 |
It should be kept in mind that the rest three are top-order batsmen and occupy the top three slots in the order, while Dhoni takes turns and plays at 4, 5, 6 and even 7 if need be. Yet, he averages better than Dhawan.
So if Dhawan, after his Champions Trophy exploits is India’s No. 1 choice for the opener’s slot, Dhoni must easily find himself floating around in the middle order. Pragmatically, looking at just the stats and their impact, Dhoni the batsman is slowly outlasting Dhoni the finisher.
Also, Dhoni’s dot-ball percentage when not scoring boundaries is the second-best amongst the four – 45.49%, only behind Kohli’s 43.4%. So he plays fewer dot balls when dealing in ones, twos, and threes than India openers while playing in the middle order and has scored 8 fifties along with a hundred.
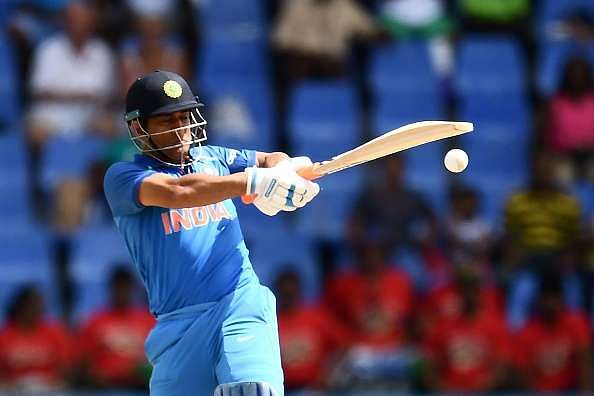
While the daggers were out again after Dhoni’s 114-ball 54, which was blamed for India’s loss in the 4th ODI vs the West Indies, it was the look that the veteran bore sitting in the dugout that tensed me more than anything else.
Statistics are a representation of a player’s performances in the long-term, and it is here that Dhoni does justice to the role that he now wants to adopt. Perhaps it has been the longing to see someone else finish off games for the side that made him appear lost after the loss, maybe it was the prospect of India never finding another Dhoni.
The question is upon ourselves. The rhetoric is upon ourselves. It isn’t Dhoni who has to go anywhere, for now, he his happy shuffling up and down the order and making howsoever many runs possible at whichever position possible.
Remember, neither did Dhoni sign up to finish games, nor should he leave if his skills at it are on the wane.
