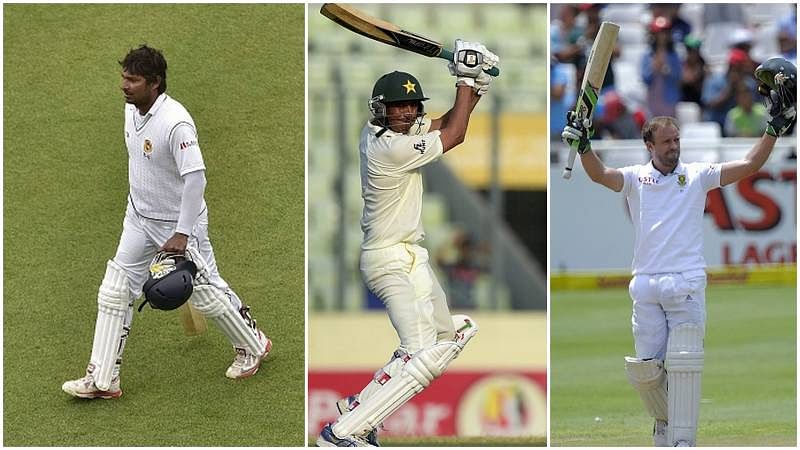
Who is the greatest match-winner in Tests among current batsmen?

It is a well-established fact that Test matches cannot be won alone. You need contribution from batsmen, bowlers and fielders alike. Hence, calling a batsman a match-winner in Tests might be a little pretentious.
But if you explore the statistics of certain batsmen, you would find that their team has rested on their shoulders throughout their career. They definitely did not win their teams Test matches on their own, but they did contribute a lot more than anyone else in Test wins for their teams.
These are the parameters by which we have set out to measure who the greatest Test batsman of current times is:
- The percentage of Man of the Match awards in the total matches played
- The percentage of Man of the Series awards in the total series played
- The difference between the average of the batsman in wins and the average of his team in wins
- The percentage of centuries out of the total centuries that resulted in wins
- The percentage of centuries scored in the total number of wins for his team
- The number of times the batsman top scored for his team in wins as a percentage of total matches won
- The number of times the batsman scored more than 40% of the team runs in wins as a percentage of the total wins
- The amount of impact a batsman had in wins
Note that the younger pool of batsmen such as Virat Kohli, Steve Smith and Angelo Mathews fail to make the cut since their sample size is comparatively too low.
Man of the Match awards
This is one of the easiest and most straightforward ways of estimating a batsman’s match-winning ability. The more Man of the Match awards you have, the greater is the match-winning ability of a batsman.
No prizes for guessing who has the highest number of Man of the Match awards in Tests among the current crop of batsmen. Kumar Sangakkara leads the way with 16 awards, with the second in the list – Chris Gayle and Younis Khan – having won only half the number of awards as Sanga.
Since the number of matches played by each player differs, let’s look at the number of Man of the Match awards won as the percentage of the total number of matches played. Again, Sanga tops the chart having won the Man of the Match award in 12.3% of the games. Paksitan’s Younis Khan is stalking Sanga, having won an award in 8.16% of the games.
|
Player |
Mat |
Awards |
Percentage |
|---|---|---|---|
|
AB de Villiers (SA) |
98 |
5 |
5.10 |
|
AN Cook (Eng) |
114 |
5 |
4.39 |
|
BB McCullum (NZ) |
94 |
5 |
5.32 |
|
CH Gayle (WI) |
103 |
8 |
7.77 |
|
HM Amla (SA) |
82 |
6 |
7.32 |
|
KC Sangakkara (SL) |
130 |
16 |
12.31 |
|
MJ Clarke (Aus) |
109 |
7 |
6.42 |
|
Younis Khan (Pak) |
98 |
8 |
8.16 |
Man of the Series awards
Just like the Man of the Match awards, the number of Man of the Series awards too functions as a benchmark to evaluate the match-winning ability of a batsman. Winning the Man of the Series award means the batsman has put up a string of match-winning performances throughout a series.
Australian Test skipper Michael Clarke tops the table with 5 Man of the Series awards, with AB de Villiers, Kumar Sangakkara and Younis Khan clinging onto the second spot with four awards each. But by the percentages, Sangakkara has fared the worst among Cook, Amla, Clarke, De Villiers and Younis Khan, having won a Man of the Series award only in 7.4% of the series.
Clarke has done prominently well, winning an award in 13.5% of the series. De Villiers is at the second spot with a Man of the Series award in 11.11% of the series.
|
Player |
Series |
Awards |
MOS % |
|---|---|---|---|
|
AB de Villiers (SA) |
36 |
4 |
11.11 |
|
AN Cook (Eng) |
34 |
3 |
8.82 |
|
HM Amla (SA) |
33 |
3 |
9.09 |
|
KC Sangakkara (SL) |
54 |
4 |
7.41 |
|
MJ Clarke (Aus) |
37 |
5 |
13.51 |
|
Younis Khan (Pak) |
42 |
4 |
9.52 |
Difference between player’s average and team’s average in wins
The difference between the average of a batsman in wins and the average of his team in wins would indicate how much better a batsman has done than his team mates in wins. Younis Khan averages 75.4 in wins, which is 32.3 more than that of his team. Meanwhile the southpaw from Sri Lanka has an average of 74.58 in victories, 26.65 more than that of his team mates.
|
Players |
Batsman’s average in wins |
Team’s average in wins |
Difference |
|---|---|---|---|
|
Younis Khan (Pak) |
75.4 |
43.1 |
32.3 |
|
KC Sangakkara (SL) |
74.58 |
47.93 |
26.65 |
|
AB de Villiers (SA) |
65.93 |
46.82 |
19.11 |
|
HM Amla (SA) |
62.62 |
46.53 |
16.09 |
|
AN Cook (Eng) |
60.54 |
45.22 |
15.32 |
|
IR Bell (Eng) |
57.77 |
45.71 |
12.06 |
|
MJ Clarke (Aus) |
56.27 |
45.06 |
11.21 |
|
DA Warner (Aus) |
55.02 |
44.84 |
10.18 |
|
BB McCullum (NZ) |
48.43 |
40.32 |
8.11 |
Top scores in victories
Ending up as the highest run getter in a Test match victory invariably makes a batsman a genuine match-winner. So if we could extract the number of times a batsman has top scored for his team in victories, it would give us an idea about the match-winning ability of a batsman. Here, the top score is calculated as an aggregate of the runs scored in both innings of a Test match.
The stylish Lankan left hander once again rocks the zenith, having been the top scorer in 16 matches. De Villiers follows him with 13 top scores in 50 Test wins.
If you go by the percentages, once again Sanga comes out looking good, with top scores in 30.769% of the wins. Pakistan’s ace batsman trounces De Villiers here, having ended up with top scores in 27.02% of the games. Younis has been the top scorer in 10 of 37 victories whereas AB de Villiers has managed to do the same in 13 of 50 victories.
|
Players |
No. of wins |
Top scores |
Percentage |
|---|---|---|---|
|
KC Sangakkara (SL) |
52 |
16 |
30.77 |
|
Younis Khan (Pak) |
37 |
10 |
27.03 |
|
AB de Villiers (SA) |
50 |
13 |
26 |
|
DA Warner (Aus) |
20 |
5 |
25 |
|
IR Bell (Eng) |
45 |
9 |
20 |
|
AN Cook (Eng) |
47 |
9 |
19.15 |
|
MJ Clarke (Aus) |
61 |
10 |
16.39 |
|
BB McCullum (NZ) |
28 |
4 |
14.29 |
|
HM Amla (SA) |
44 |
5 |
11.36 |