
The Leicester City story- Part 2

Part 1 analyzed why Leicester City could be backed to possibly pull off one of the biggest coups in football history, again. But Part 1 only showed half the picture. In this part, we look at certain metrics in which the Foxes have defied the statistical odds. Such is the importance of these measures, that if the numbers reassert normalcy, Leicester might end up getting the short end of the stick. It is a little paradoxical, but I guess that's the inherent nature of football.
Fortunate with injuries, or rather, the lack thereof
Four players have played every minute for Leicester this season. No other team in the Premier League has had more than three players play every minute. six players for Leicester have played some part in all 16 matches. Out of these six, four are members of the Leicester back five (four defenders + 1 GK). In contrast, Manchester City’s most played defender is Kyle Walker, with 1095 minutes out of a possible 1440, Fernandinho comes in next with 1039, and he’s only provisionally part of the back four. The next member of their broken defence (based on the most number of minutes for Man City) is Ottamendi, with 726 minutes, out of a possible 1440 (That’s just a little more than 50%).
Vardy’s freakish form
Jamie Vardy’s expected goals for the shots he has taken puts him at 10.53 goals, 5.47 less than his actual goal tally of 16. Vardy has scored his 16 goals while just taking 41 shots. That’s about a goal in every 2.56 shots he takes. A goal in 2.56 shots is the lowest for any player in all the 5 leagues this season (only considering players who have scored more than 5 goals). To provide some perspective, Lionel Messi comes in this table at 12th position with a goal in every 3.25 shots he takes. (Side Note: Ronaldo at Juventus has taken 9.71 shots per goal, that’s the second-worst out of the 117 players who’ve scored 5 or more goals)
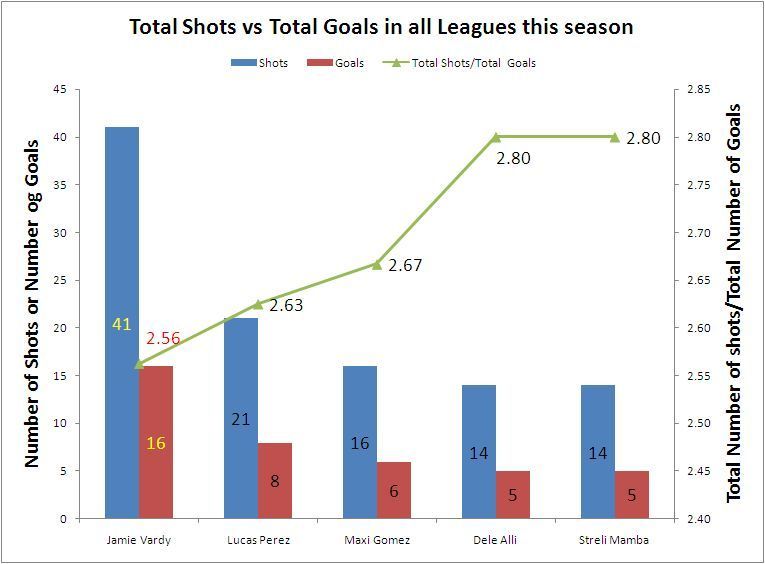
Look at the chart above. The chart shows the players with the least number of shots per goal (5 or more than 5 goals) in the top 5 leagues. Footballers at positions 2nd, 3rd, 4th, and 5th have all taken fewer shots than Vardy. The one player who comes close in terms of shots frequency in this table is Lionel Messi (with 39 shots, a goal every 3.25 shots). Ciro Immobile, who has scored an astonishing 17 goals this season, has taken 58 shots, Vardy has taken 41 to score 16. When we sort the table in ascending order based on shots/goals, Vardy comes out first, as mentioned before, but there’s something else you should know. No one in the first 15, except the footballing freak Messi, had more than 10 goals. Vardy has 16 and as likely as it is a technical skill, there’s a high chance that this statistical anomaly could regress to the mean soon and Vardy could lose his splendid goal-scoring touch.
To help you better understand how exceptionally accurate has Vardy been with his finishing, look at the chart below. These are EPL players with the lowest shots/goals ratio.
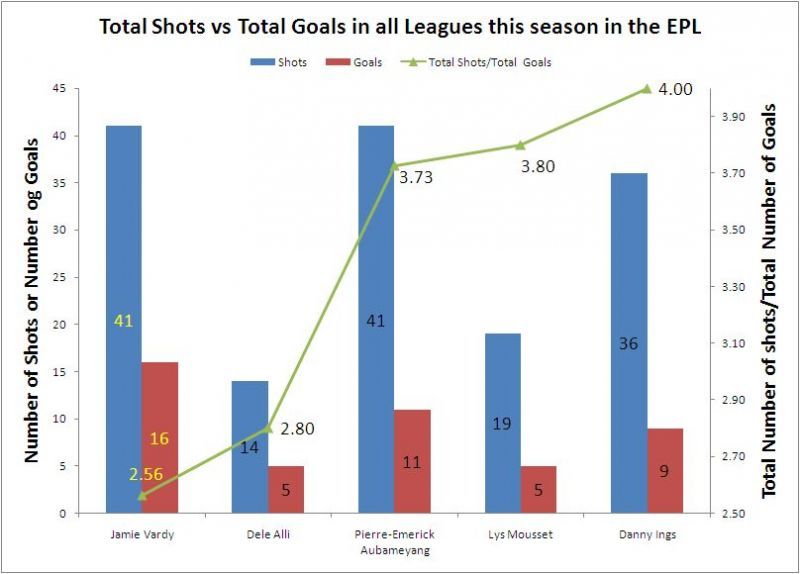
Sergio Aguero, who is known to be a lethal finisher is 12th in the EPL according to this stat, with a goal every 4.67 shots. Harry Kane and Rashford have taken 4.88 and 5.1 shots respectively for every goal they’ve scored this season.
Leaving it too late?
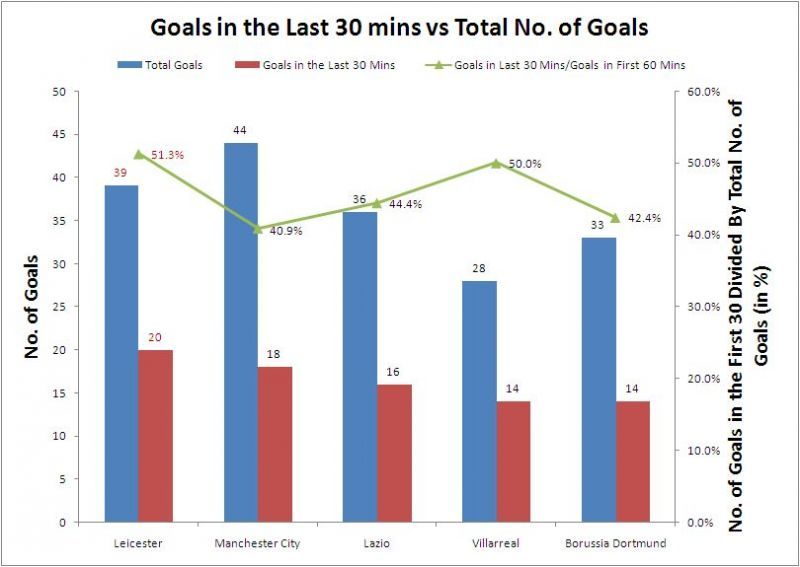
Leicester have scored 20 goals in the last 30 mins of their games. That’s the highest total by any team in all the 5 leagues this season (only 2 out of the 9 goals that were scored in the 9-0 annihilation of Southampton were scored in the last 30 mins ). Astonishingly, they’ve scored more in the last 1/3rd (last 30 minutes) than they’ve scored in the starting 2/3rd of games (first 60 minutes).
This could mean one of two things. Firstly, it could mean that Leicester players are outlasting their opponents in terms of stamina and will, and are going that extra mile in the last 3rd (last 3rd in terms of the minutes elapsed in the game and last 3rd of the pitch, i.e. deep in their opponent's half). Conversely, it could also spell trouble for Leicester in the long run as historically, teams that are so dependent on scoring goals in the last 30 mins are teams that languish in the bottom half of the table.
Out of the 36 teams that scored more goals in the last 30 minutes than they did in the first 60, 25 finished the season in the bottom half of the table. 10 of these 25 teams finished in the Bottom 3 in their respective leagues.
Does the B(L)uck stop here?
Football is a low scoring game.
According to 21st club, “the team who deserves to win the match will only take all three points around 60% of the time – such is the volatile nature of our low scoring sport.”
Leicester have outperformed not only the Expected Points metric (by almost 10 points) but also the Expected Goal Difference metric (xGD). That is, they’ve scored 11.2 more goals than they ideally should have, and they’ve conceded 6.6 goals less than they should have. This means that they’ve outperformed their xGD metric by 17.8 goals,
That’s the most in the Premier League, by a large margin. Newcastle comes in second with 9.8 goals, almost a 45% drop.
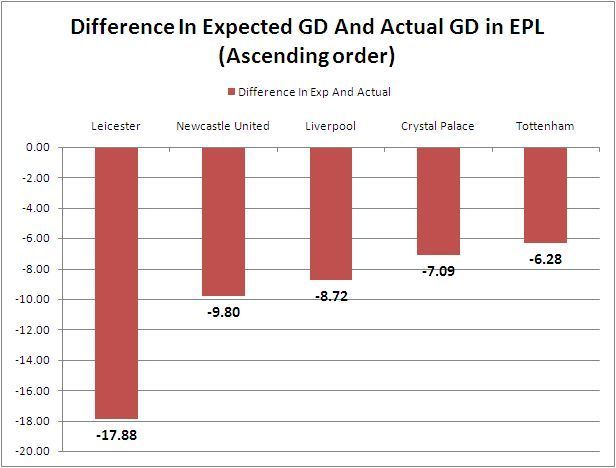
The chart below shows how the current top 5 in the EPL fare based on the same metric. Leicester have clearly eclipsed their title rivals. They are 5th on expected points – 28.3 points, almost 10 less than what they have now.
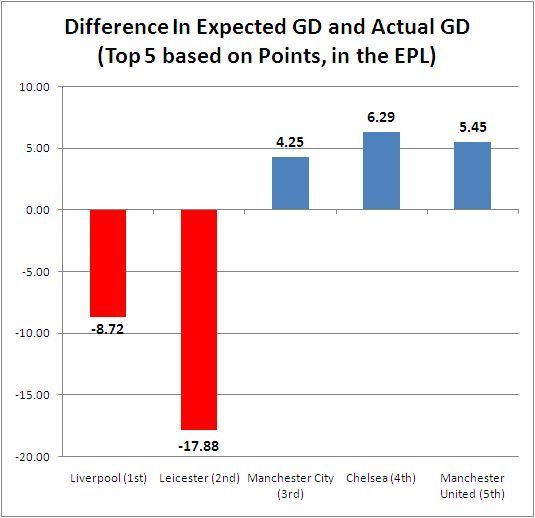
The disparity becomes more evident when compared to the 98 teams in the top 5 leagues. Leicester comes in 2nd, pipped to the top spot by 4th placed Cagliari. 2nd out of 98 teams. Can they sustain it at this rate? Only time will tell.
Statistically speaking, Leicester have been on the two ends of the spectrum. With a manager seemingly at the peak of his powers, they’ve been able to set up with a defined style of play that suits the players at the manager’s disposal but as seen above, they’ve arguably been blessed at times by Goddess Fortuna herself. It’s difficult to predict how this whole scenario will pan out but there’s one thing for sure - Brendan Rodgers and his team wouldn’t want to leave it to the wheel of fortune to decide their fate. Because all that is required is a little push (or a slip)
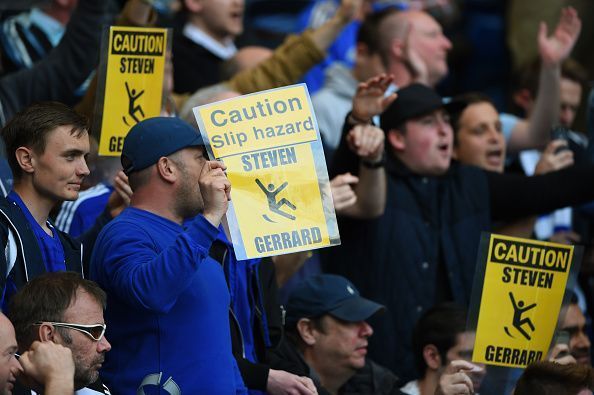
I know the manifold deceits of that monstrous lady, Fortune; in particular, her fawning friendship with those whom she intends to cheat, until the moment when she unexpectedly abandons them, and leaves them reeling in agony beyond endurance. - Boethius (c. 480-524)
Also check out: